The visual approach to education comes with numerous benefits as shown by several decades of study. Researchers have proven over the years that there is an undeniable link between mental imagery, visual cues, and the process of learning and recalling knowledge.
In some cases, learning through visual sources, such as videos, has proven just as effective as being taught by experienced instructors in person.
This is the primary reason why TradingPedia decided to create a page, exclusively dedicated to educational video materials. With TradingPedia’s video education, you can improve your chance of turning a profit from the financial markets.
The video library contains valuable information that can help novices progress on their path toward becoming smart and successful traders. With TradingPedia’s help, you can better understand how trading the financial markets works.
The subjects covered in the comprehensive video library comprise a rich variety of trading-related subjects, including money management, types of trading sessions, chart types, gaps, technical indicators, trends and trendlines, wedges, and double, and triple tops.
Also included are adequate explanations of how monetary policies and different economic phenomena, such as inflation, can impact price movements.
Here you will be able to visually learn about some of the most broadly used trading platforms, like MetaTrader, what their features are and how they work.

1. Start by mastering the trading terminology
It makes sense that the first thing you must do, if you are a beginner trader, is to get acquainted with the trading terminology, or else you will be unable to gain an adequate understanding of this complex subject matter.
You can achieve this by checking out TradingPedia’s exclusive video on the Most Used Forex Trading Terms. It is important to understand professional investors have used these trading terms for years and are likely to continue to do so in the decades to follow to get the most accurate forex signal.
The video explains in a comprehensible manner all the key terms you need to know if you are completely new to this field. These include spreads, ask and bid prices, the bearish and bullish approaches to trading, pips, and the nicknames of the main currency pairs on the Forex market.
Spread refers to the differences between the quoted ask and bid prices of a given financial asset, such as a currency pair. This is basically a built-in fee the traders pay to the brokerage for the service.
Pips are used to measure the price movements in different assets like Forex pairs. A single pip reflects the smallest fluctuation in the price of a given currency.
Ask price is used in reference to the lowest price a trader might agree on when looking to sell an asset. The bid price is the opposite or the price at which the brokerage agrees to buy an asset.
Nicknames are often used by experienced traders in reference to the most liquid and popular currencies and currency pairs. Some examples include “fibre” for the EUR/USD pair, “kiwi” for NZD, Aussie for AUD/USD, “loonie” for CAD, and “the cable” for GBP/USD.
Bullish traders are those who think that the price of a given asset will go up. They would open a long position, i.e. buy the asset at a lower price, in hopes of selling it at a profit in the future when its value escalates.
Bearish traders are the opposite of bullish ones, i.e. they think there will be a downward swing in an asset’s price. Respectively, they will try to capitalize on the decline.
2. Money management is essential
It is impossible to become a successful trader if you fail to manage your risk adequately. TradingPedia takes you through all the basics of risk management via an informative video that tackles important subjects such as the risk-reward ratio, how to set up your stop-loss, and choosing a maximum loss threshold.
In short, the risk-reward ratio (RR ratio) reflects the potential profits a trader can register per each dollar they invest in a given trading position. It is commonly used by experienced investors to plan what positions to open.
To calculate your RR ratio, you can divide the overall amount of money you can potentially lose if the market moves against you by the amount you expect to gain upon closing your position successfully. One example of a proper risk-reward ratio is 1:2.
Stop-loss orders are equally important but you need to set them properly to benefit from them. A stop-loss order is an instruction that tells the trading platform to buy or sell a given asset when it moves to a specific price.
TradingPedia’s videos will also teach you how to set a maximum loss threshold. The rule of thumb is to never expose more than 1% to 2% of your trading account’s balance to risk when opening any given position.
3. Trading sessions
There are several trading sessions beginner traders must familiarize themselves with. TradingPedia’s informative video on the subject will acquaint you with the Asian, London, and North American trading sessions. Their expert traders also explain the trading week, which commences with the Asian trading session, whose liquidity is very low on Mondays.
By contrast, the London trading session is the most active and liquid of the three since it accounts for more than 35 per cent of the overall turnover of the foreign exchange market. It overlaps with the New York one all throughout the year. The massive trading volume inherent in the London session resulted in spread reduction and lower costs for majors like USD/CHF, EUR/USD, GBP/USD, and GBP/USD.
As for the North American trading session, the City That Never Sleeps accounts for roughly 17 per cent of the trading volume of the foreign exchange market. However, there are other major financial centres on the North American continent, including Chicago in the state of Illinois and Canada’s Toronto. If you are looking to swing trade, you are recommended to do it during the North American or London sessions.
4. Chart types explained
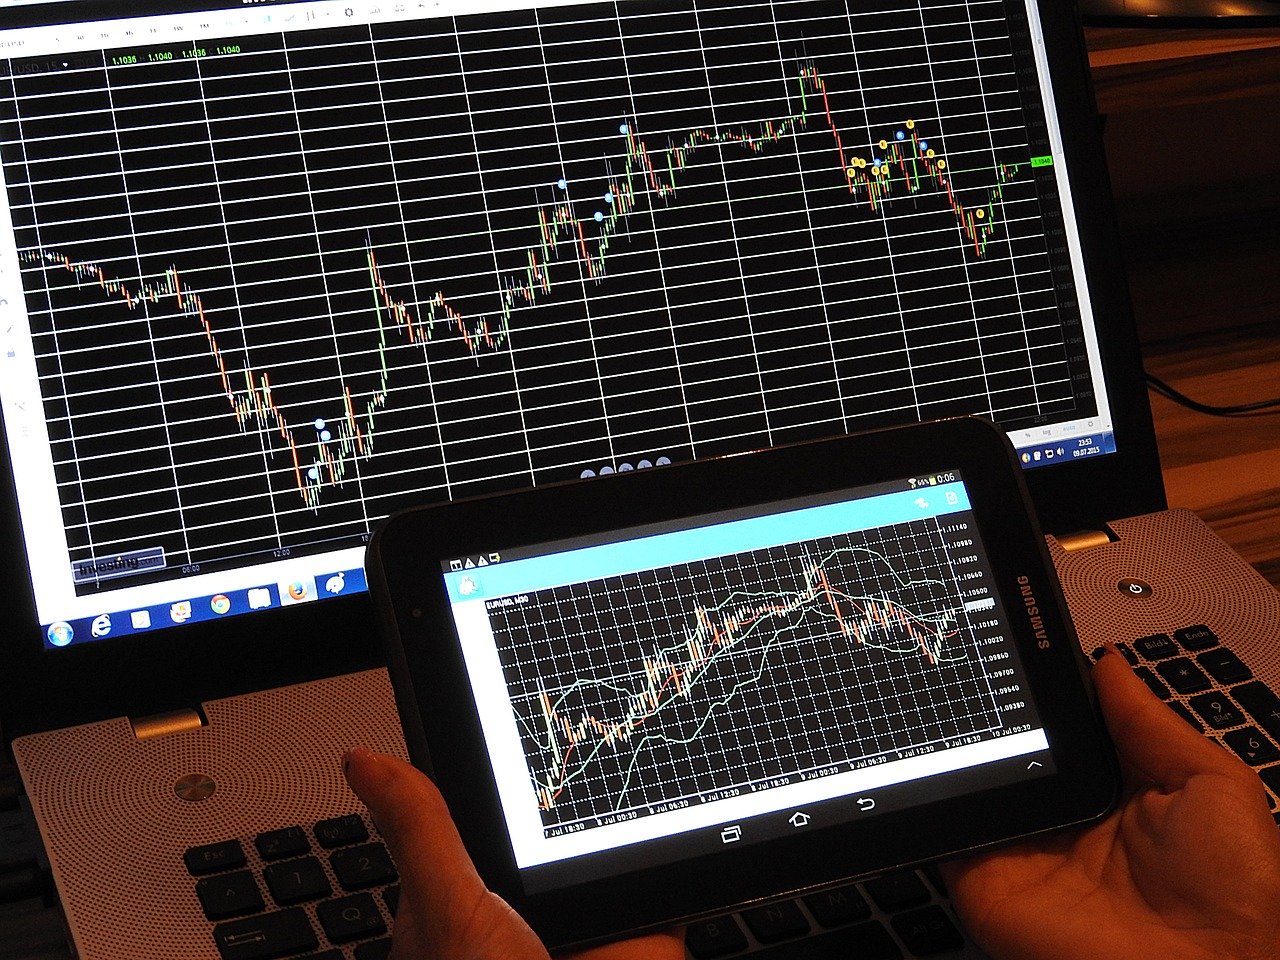
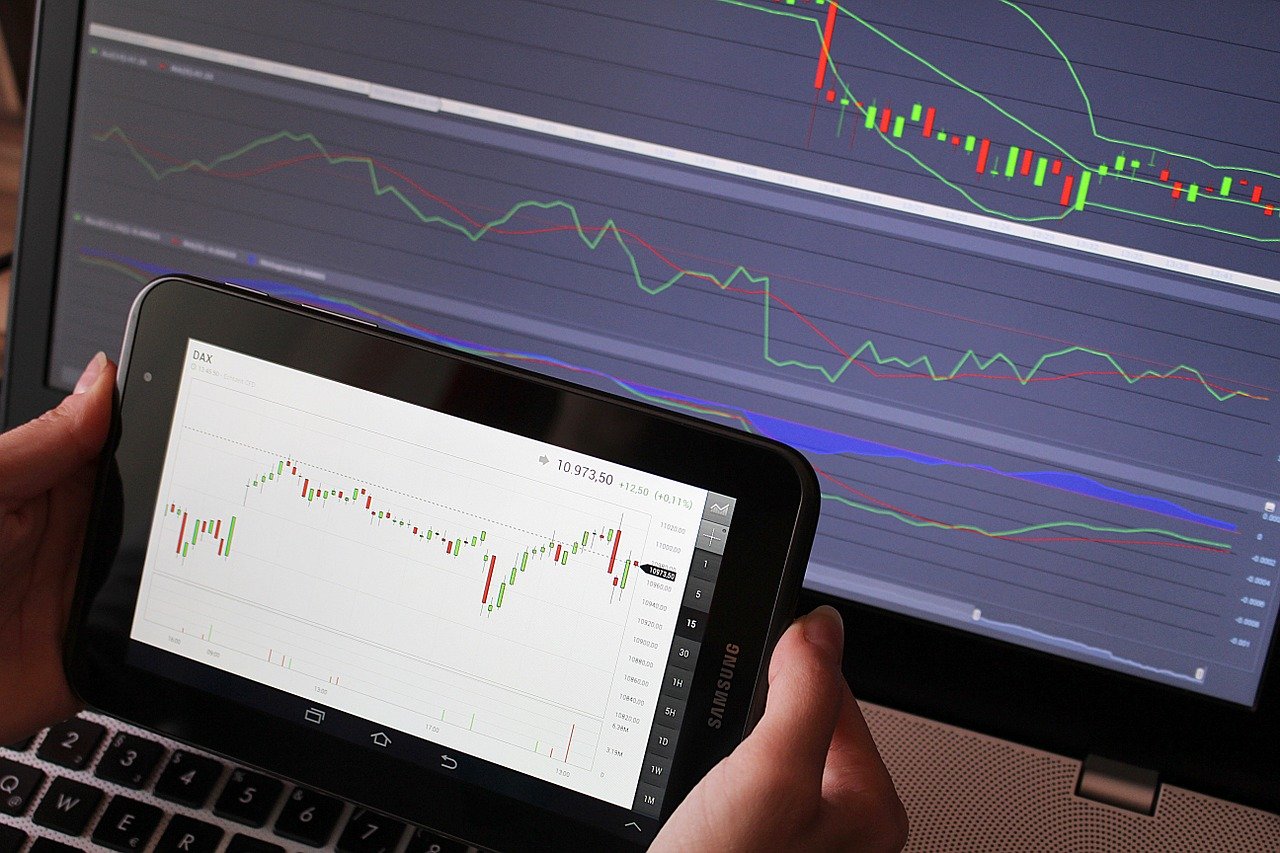
One of the videos in TradingPedia’s video library discusses the subject of trading chart types. Our video uses the popular MetaTrader 4 software as an example, although similar chart types can be found in other trading platforms. The video covers the three main chart types, namely the candlesticks, line charts, and bars.
Candlesticks are the most frequently used type by beginners and retail traders. This chart type was first pioneered in the late 1990s by the recognized author Steve Nison in his masterpiece book Japanese Candlestick Charting Technique. A candlestick chart displays the opening and closing price values for each trading period. It helps investors determine the potential price fluctuations, depending on previous market patterns.
A bar chart bears some semblance to the candlestick as it displays the opening, closing, high, and low prices of assets for a given period of time. It is often colour-coded and comprises a collection of bars that represent different prices.
The line chart is the simplest chart type and as such, works best for beginner traders. One distinctive trend of the line chart is that it links the closing prices for specific periods. The chart is applicable to different timeframes and reflects the fluctuations in the assets’ closing prices.

5. Trading platforms
TradingPedia’s video library also features a tutorial for MetaTrader 4. By far, this is the most commonly used trading platform in the world. It also has an upgraded version, the MetaTrader 5. It boasts all the capabilities of its predecessor plus some additional features, to boot.
Back to MetaTrader 4, it supports many handy features traders can take advantage of, including customizable candlestick, bar, and line charts.
Another useful feature explained in our video is AutoTrading. It eliminates the human-emotions factor and allows traders to create, test, and use the so-called Expert Advisors.
These are preprogrammed trading robots that would execute trades for you when you are away from your computer. It is possible to buy them from the MetaTrader 4 marketplace or develop your own robots for automated trading. TradingPedia’s video on MT4 also tackles how technical analysis via this platform works. Also explained is how to draw and edit trendlines via MT4.
6. Advanced video tutorials
TradingPedia strives to cater to all audiences. This is why our video library is tailored to the needs of traders from all skill and experience levels. The library features a variety of video tutorials that tackle more advanced subjects such as Elliott Waves, Bollinger Bands indicators, the Hammer Pattern, and ascending and descending triangles.
We briefly explain each of these below and suggest you visit our video library for further tips and information on these advanced topics.
Elliot Waves was pioneered by the US author and accountant Ralph Nelson Elliott in the 1930s. He introduced one of the most powerful and effective forms of technical analysis. It is used to spot trends and patterns in the markets. He distinguished between two types of waves – impulsive and corrective.
This method of technical analysis enables traders to identify recurrent long-term patterns in asset price movements that have to do with ongoing changes in traders’ behaviour and psychology.
The Bollinger Bands indicator is used for technical analysis and was named after its creator John Bollinger, a highly recognized financial analyst and renowned author from the USA.
This technical indicator is also available in the MetaTrader 4 platform we previously wrote about. You will find it in the Insert/Indicators/Trend menu.
You can customize the indicator to adjust the periods. The Bollinger Bands indicator is implemented for the purpose of measuring market volatility and spotting the so-called overbought and oversold conditions.
Our video library also includes a video explaining how to trade the hammer pattern. It tackles one very essential subject in the field of technical analysis.
This is basically a pattern of an asset’s prices in the candlestick charts. This pattern manifests itself whenever an asset’s price drops. It is called so because it appears hammer-shaped on the chart. Traders can take advantage of the Hammer Pattern when determining whether to enter a market or not.
Ascending and descending triangles are also covered in a separate video at TradingPedia. This is yet another important concept from the field of technical analysis. Ascending and descending triangles are among the most common continuation patterns in technical analysis and can manifest themselves in any market.
The descending triangle indicates to traders that the demand for a certain financial instrument, be it a derivative, a soft or hard commodity, or an asset is declining. The ascending triangle is practically the counterpart of the descending one. This is a bullish pattern that indicates those who buy the respective asset or derivate are more aggressive than those who sell it.
These topics, among many more, are readily available in TradingPedia’s video library at no cost. Regardless of whether you are a beginner or have previous experience in trading, we believe our informative and comprehensible video content can help you improve your skills and knowledge.

I am Adeyemi Adetilewa, an SEO Specialist helping online businesses grow through content creation and proven SEO strategies. Proficient in WordPress CMS, Technical Site Audits, Search Engine Optimization, Keyword Research, and Technical Writing (Portfolio).
I help brands share unique and impactful stories through the use of public relations, advertising, and online marketing. My work has been featured in the Huffington Post, Thrive Global, Addicted2Success, Hackernoon, The Good Men Project, and other publications.
